Connolly, Johnny (2013) Legal proceedings for drug offences 2004–2011. Drugnet Ireland, Issue 46, Summer 2013, pp. 20-21.
| Preview | Title | Contact |
|---|---|---|
|
PDF (Drugnet Ireland 46)
- Published Version
881kB |
This article looks at trends in legal proceedings for drug offences in the years 2004–2011. It should be noted that drug offence data are primarily a reflection of law enforcement activity. Consequently, they are affected in any given period by such factors as law enforcement resources, strategies and priorities, and by the vulnerability of drug users and drug traffickers to law enforcement activities. Having said that, when compared with other data sources such as drug treatment for example, they can provide a useful indicator of overall drug trends. Alternatively, where law enforcement trends differ from those of other data sources in a given period they may reveal something about specific law enforcement strategies or activities at that time, something that can be further investigated through research.
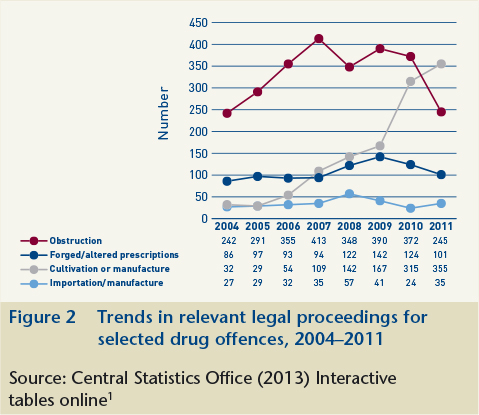
Obstruction offences often involve an alleged offender resisting a drug search or an arrest or attempting to dispose of drugs to evade detection. Such offences continue to account for the largest number of prosecutions, although numbers declined from a high of 415 in 2007 to 245 in 2011, approaching the 2004 figure of 242. Proceedings for the offence of forged/altered prescriptions have also remained fairly constant since 2004. Another noteworthy development has been the continued increase in the offence of cultivating/manufacturing controlled drugs. Proceedings for this offence have continued to increase since 2005, when there were 29 related proceedings, reaching 167 in 2009 and then more than doubling to 355 in 2011. It is unclear whether this increase reflects a genuine growth in the commission of such offences or a sustained concentration of law enforcement on their detection. For example, in 2010, the Garda Síochána conducted Operation Nitrogen, a nationwide investigation into cannabis cultivation sites by district and divisional drug units.2 Although the specific focus of this operation may have had an impact on the data presented here, a recent report jointly published by the EMCDDA and Europol highlighted the increased involvement of organised crime groups in cannabis cultivation in many European countries, including Ireland.3
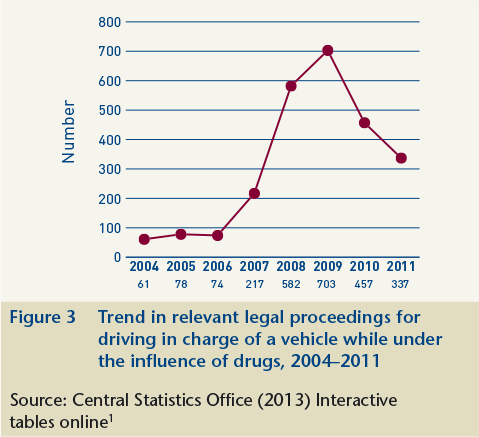
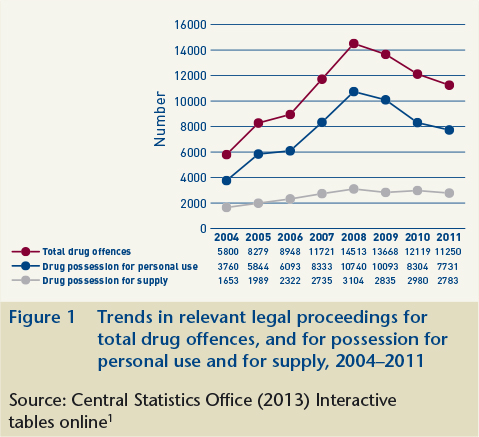
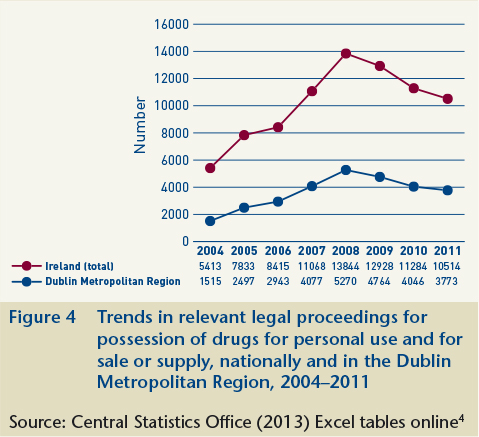
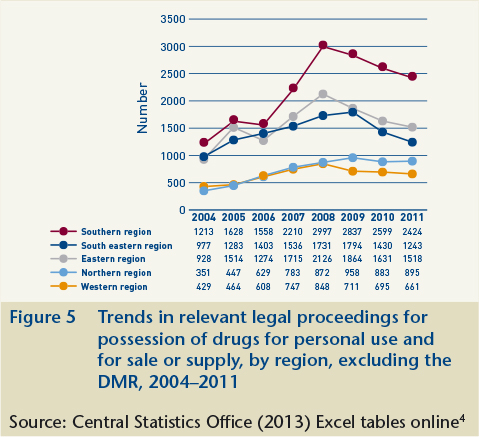
Drug offence data can assist us in understanding aspects of the operation of the illicit drug market in Ireland. Data on drug offence prosecutions by Garda division are a possible indicator of national drug distribution patterns. While these data primarily reflect law enforcement activities and the relative ease of detection of different drugs, when compared with other sources, such as drug treatment data, for example, they can show us trends in market developments throughout the State. Such data can also indicate trafficking patterns by showing whether there is a concentration of prosecutions along specific routes. Figures 4 and 5 show trends in relevant legal proceedings for possession of drugs by Garda region. It should be noted that possession offences include both possession for personal use and possession for the purpose of supply. It is not possible to distinguish between these two offences in the data reported by Garda region. However, in the country as a whole, possession for personal use accounted for between 65% and 75% of all possession cases in the years 2004–2011 (Figure 1).
MM-MO Crime and law > Substance related offence > Drug offence > Illegal drug possession (seizures)
VA Geographic area > Europe > Ireland
T Demographic characteristics > Person who commits a criminal offence (offender)
MM-MO Crime and law > Justice system
MM-MO Crime and law > Substance related offence > Drug offence > Illegal transportation of drugs (smuggling / trafficking)
MM-MO Crime and law > Substance related offence > Drug offence > Illegal distribution of drugs (drug market / dealing)
A Substance use and dependence > Substance related societal (social) problems > Drug use and driving
Repository Staff Only: item control page