Connolly, Johnny (2012) Drugs and crime data 2012. Drugnet Ireland, Issue 43, Autumn 2012, pp. 29-31.
| Preview | Title | Contact |
|---|---|---|
![[img]](https://www.drugsandalcohol.ie/style/images/fileicons/application_pdf.png)
|
PDF (Drugnet Ireland issue 43)
- Published Version
1MB |
This article looks at trends in reported drug offences and drug seizures for various periods between 2003 and 2011. It should be noted that drug offence and seizure data are primarily a reflection of law enforcement activity. Consequently, they are affected in any given period by such factors as law enforcement resources, strategies and priorities, and by the vulnerability of drug users and drug traffickers to law enforcement activities. Having said that, drug seizures are seen as indirect indicators of the supply and availability of drugs.
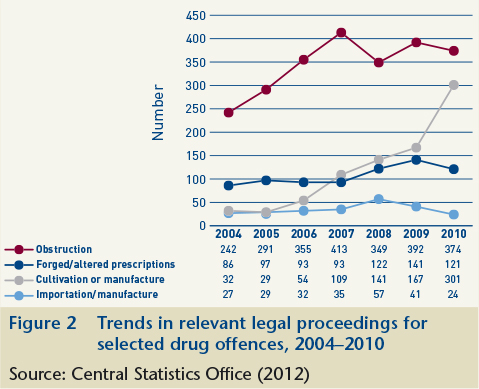
Obstruction offences often involve an alleged offender resisting a drug search or an arrest or attempting to dispose of drugs to evade detection. Such offences continue to account for the largest number of prosecutions, although the number declined slightly in 2010 following an increase in 2009.A similar trend can be observed in relation to the offence of being in possession of forged/altered prescriptions.
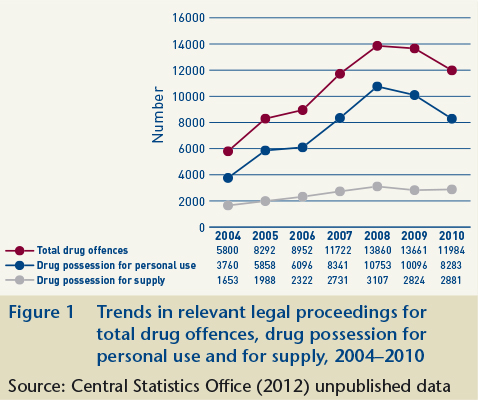
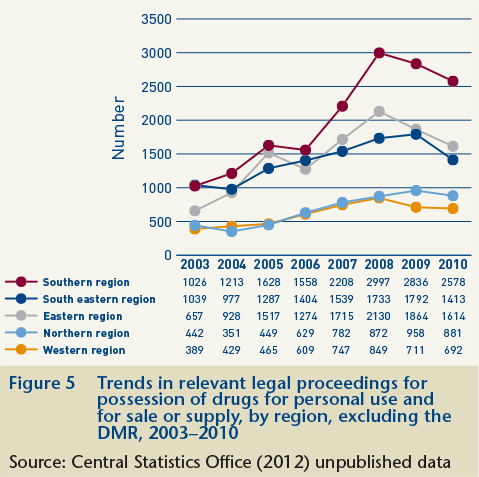
Drug offence data can assist us in understanding aspects of the operation of the illicit drug market in Ireland.2 Data on drug offence prosecutions by Garda division are a possible indicator of national drug distribution patterns. While these data primarily reflect law enforcement activities and the relative ease of detection of different drugs, when compared with other sources, such as drug treatment data, for example, they can show us trends in market developments throughout the State. Such data can also indicate trafficking patterns by showing whether there is a concentration of prosecutions along specific routes. Figures 4 and 5 show trends in relevant legal proceedings for possession of drugs by Garda region. It should be noted that possession includes possession for personal use and possession for the purpose of supply. It is not possible to distinguish between these two offences in the data reported by Garda region. However, as shown in Figure 1 above, it is generally the case that in 65%–75% of all possession cases the drugs are deemed to be for personal use.
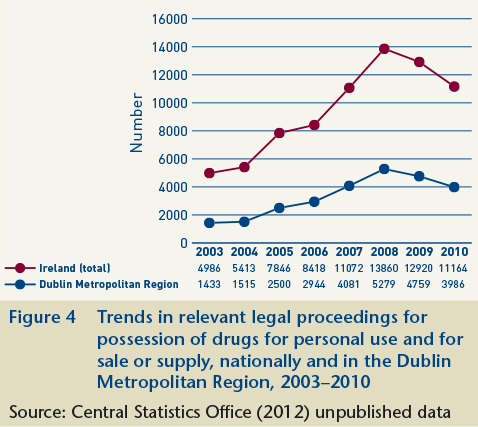
Figure 5 shows trends in supply offences by Garda region, excluding Dublin. Trends in supply offences have increased in all regions since 2003. This reflects the reality that drug markets are no longer primarily a Dublin-based phenomenon.. Following this general increase throughout the country since 2003, relevant legal proceedings for drug possession (for personal use and supply) decreased in all regions between 2008 and 2010, with the exception of the Northern Region where there was a slight increase in 2009 on the previous year, followed by a decrease in 2010.
Drug seizures
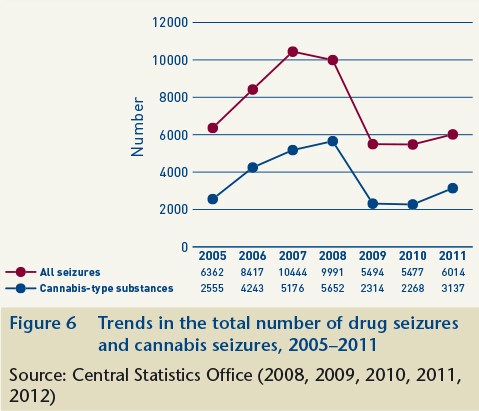
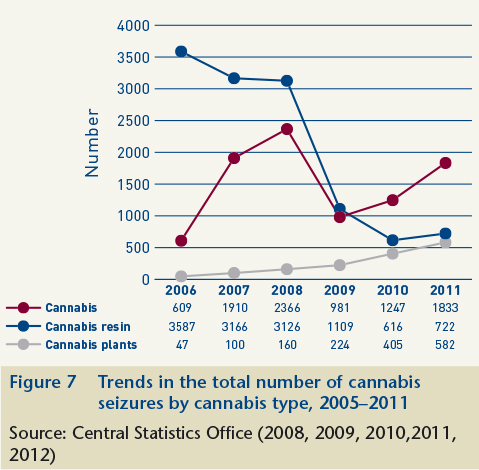
Cannabis seizures account for the largest proportion of all drugs seized. Figure 6 shows trends in cannabis-related seizures and total seizures between 2005 and 2011. The total number of drug seizures increased to a peak of 10,444 between 2005 and 2007. Between 2007 and 2010, the number almost halved, to a total of 5,477 in 2010. This decrease in total seizures since 2007 can be explained primarily by the significant decrease in the number of seizures of cannabis-type substances. It should be noted that not all drugs seized by law enforcement are necessarily analysed by the Forensic Science Laboratory, and are therefore not officially reported by the CSO. However, it is difficult to know if the reduction in cannabis-related seizures reflects a decline in cannabis use or a reduction in law enforcement activity. It may also be partly explained by a change in the nature of cannabis use, with people moving from resin use to the use of more potent forms of cannabis. For example, as shown in Figure 7, when we look more closely at cannabis-related seizures it can be seen that although seizures of cannabis resin decreased between 2009 and 2011, there has been a steady increase in seizures of cannabis plants since 2006, while herbal cannabis seizures almost doubled between 2009 and 2011, increasing from 981 to 1,833.
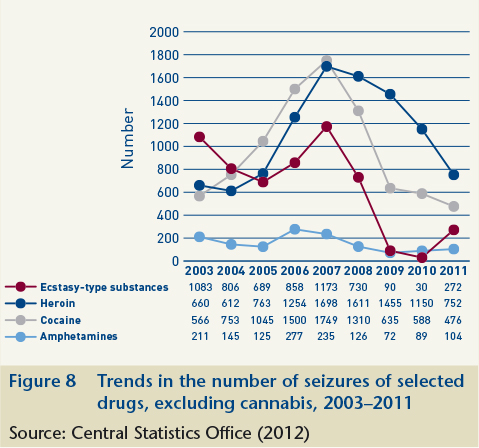
The reduction in the total number of reported seizures since 2007 shown in Figure 6 may also be a consequence of the reduction in the number of seizures of other drugs since 2007. Figure 8 shows trends in seizures for a selection of drugs, excluding cannabis, between 2003 and 2011. There has been a significant decline in seizures of cocaine and heroin since 2007. Seizures of ecstasy-type substances also decreased significantly between 2007 and 2010, but increased by more than 900% in 2011.
1. An Garda Síochána (2012) Annual report 2011. Dublin: An Garda Síochána. www.drugsandalcohol.ie/17953
2. Connolly J (2005) The illicit drug market in Ireland. HRB Overview Series 2. Dublin: Health Research Board. www.drugsandalcohol.ie/6018
MM-MO Crime and law > Substance related offence > Drug offence > Illegal drug possession (seizures)
VA Geographic area > Europe > Ireland
T Demographic characteristics > Person who commits a criminal offence (offender)
MM-MO Crime and law > Crime > Substance related crime
MM-MO Crime and law > Crime and violence
MM-MO Crime and law > Crime > Substance related crime > Crime associated with substance production and distribution
MM-MO Crime and law > Organised crime
Repository Staff Only: item control page