Sinclair, Hamish (2006) Estimating the true prevalence of drug use in the population. Drugnet Ireland, Issue 18, Summer 2006, pp. 6-7.
| Preview | Title | Contact |
|---|---|---|
|
PDF (Drugnet Ireland, issue 18)
- Published Version
882kB |
In March 2006 the National Advisory Committee on Drugs (NACD) in Ireland and the Drug and Alcohol Information and Research Unit (DAIRU) in Northern Ireland published confidence intervals for the prevalence estimates from the 2002/2003 drug prevalence survey.1,2 This article will help explain in non-technical terms the importance of confidence intervals and how to interpret the recently published figures.
The term ‘prevalence’ in the context of drug use refers to the proportion of a population who used a drug over a particular time period. Information on drug use among the population is usually gathered through surveys and prevalence is measured by asking respondents in a sample randomly drawn from the population to recall their use of drugs. For example, in Ireland, the lifetime prevalence (ever used drug in lifetime) of cannabis for adults (15–64 years) was estimated to be 17.4% in 2002/2003. Since this estimate is based on a sample, the true prevalence in the population may be different.
Provided a sample is ‘representative’ of the total population, prevalence information obtained from it can be used to infer the prevalence in the population with a certain degree of confidence. The representativeness of a sample refers to the extent to which it mirrors the population of interest. The calculation of a confidence interval provides us with upper and lower value limits that contain the true value with a degree of certainty. By convention, a 95% level of certainty is chosen for confidence intervals in drug prevalence surveys. For example, the recently published 95% confidence interval for lifetime prevalence of cannabis is reported as ranging from 16.3% to 18.4% (Table 1). Thus we can say that we are 95% confident that the true proportion of cannabis users in the population is in the range 16.3%–18.4%. In other words, the prevalence could be as low as 16.3% or as high as 18.4%. To obtain an exact prevalence figure, the entire population would have to be surveyed – which would be prohibitively expensive.
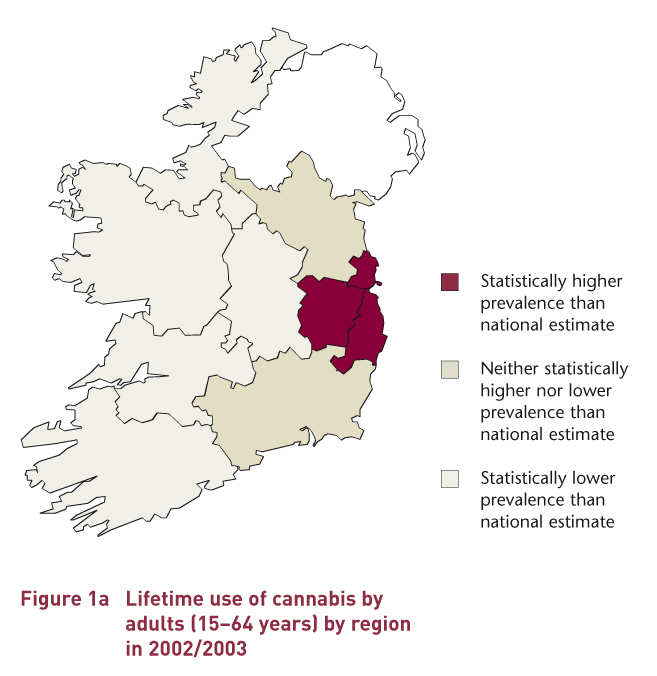
Table 1 shows the lifetime, last-year and last-month use of cannabis by adults, by region (former health board area). While some of the regional prevalence estimates are much higher than the national estimate and others are lower, the confidence intervals allow us to determine whether the regional estimates differ significantly from the national estimate. If the range of values for a regional estimate did not overlap the range of values for the national estimate, this would be regarded as a statistically significant difference (i.e., the difference is unlikely to be due to chance). For example, lifetime prevalence of cannabis in the East Coast Area ranges from 20.8% to 28.2%, while the national estimate ranges from 16.3% to 18.4%; thus, the East Coast Area estimate is regarded as statistically higher than the national estimate.
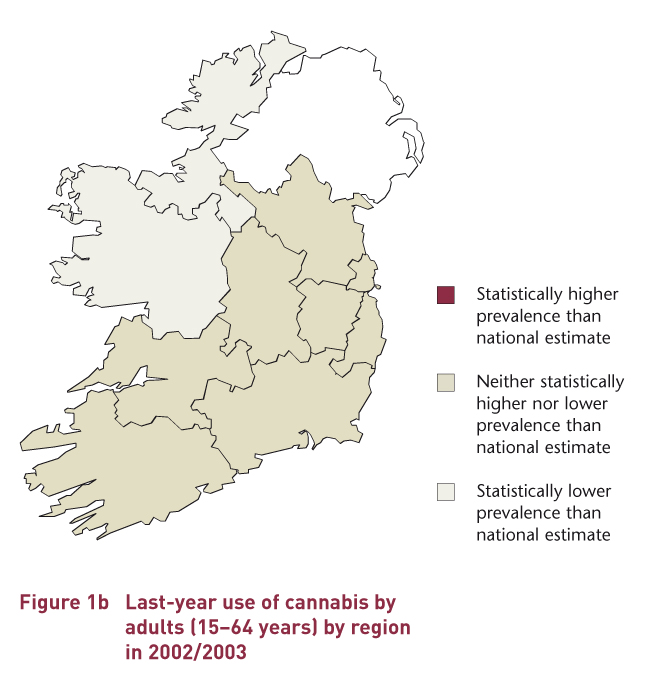
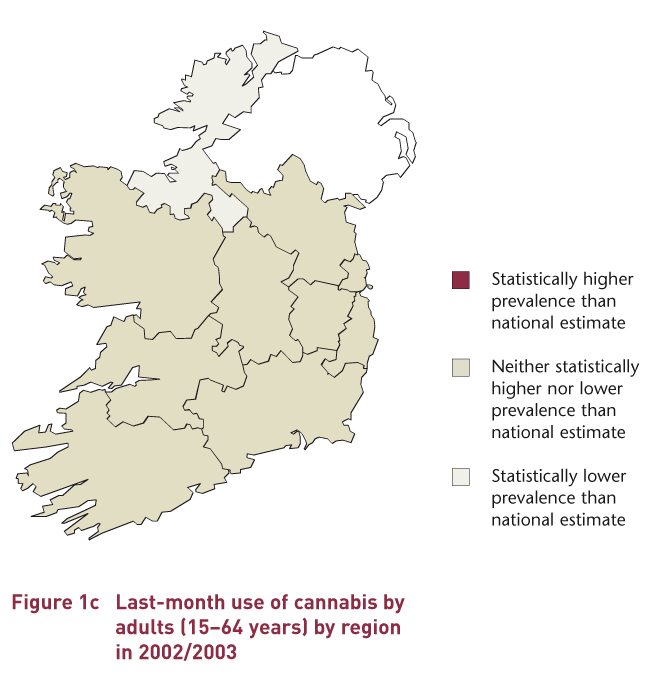
Figures 1a to 1c show the regions that have statistically higher or lower prevalence estimates for cannabis use compared to the national estimate. For lifetime prevalence, only three regions have estimates statistically higher than the national estimate and four areas have statistically lower estimates (Figure 1a). For both last-year and last-month prevalence, no region has an estimate statistically higher than the national estimate (Figures 1b and 1c). This is due to two factors: the low number of people who used cannabis in the last year or last month and the small number of people in each of the regional samples.
In general, the larger the sample the narrower the confidence intervals and the more precise we can be in estimating the true prevalence of drug use in the population. It is good practice to provide confidence intervals to indicate the level of precision associated with survey estimates.
1. National Advisory Committee on Drugs and Drug and Alcohol Information and Research Unit (2006) Drug use in Ireland and Northern Ireland. 2002/2003 drug prevalence survey: first results (revised) from the 2002/2003 drug prevalence survey – Bulletin 1. Confidence Intervals. Dublin: National Advisory Committee on Drugs.
2. National Advisory Committee on Drugs and Drug and Alcohol Information and Research Unit (2006) Drug use in Ireland and Northern Ireland. 2002/2003 drug prevalence survey: Health Board (Ireland) & Health and Social Services (Northern Ireland) results (revised) – Bulletin 2. Confidence Intervals. Dublin: National Advisory Committee on Drugs.
Table 1 Lifetime, last-year and last-month use (%) of cannabis by adults (15–64 years) by region (former health board area) in 2002/2003. Figures in brackets are 95% confidence intervals.
|
Region (former health board) |
Use of cannabis |
||
|
|
Lifetime |
Last year |
Last month |
|
|
% (95% CI) |
% (95% CI) |
% (95% CI) |
|
|
|
|
|
|
East Coast Area |
24.5 (20.8–28.2) |
6.1 (4.1–8.2) |
3.8 (2.2–5.5) |
|
Northern Area |
26.9 (23.3–30.4) |
7.7 (5.5–9.8) |
4.5 (2.9–6.2) |
|
South West Area |
23.2 (20.1–26.3) |
7.3 (5.4–9.2) |
3.9 (2.5–5.3) |
|
Midland |
10.7 (7.0–14.4) |
2.8 (0.8–4.7) |
1.0 (0.2–3.2) |
|
Mid-Western |
10.9 (7.9–13.9) |
3.0 (1.3–4.6) |
1.6 (0.4–2.9) |
|
North Eastern |
17.8 (14.1–21.4) |
5.2 (3.0–7.3) |
1.9 (0.6–3.2) |
|
North Western |
9.3 (5.8–12.8) |
2.2 (0.4–3.9) |
0.2 (0.0–1.9) |
|
South Eastern |
16.8 (13.6–20.0) |
5.8 (3.8–7.8) |
2.1 (0.9–3.4) |
|
Southern |
11.6 (9.2–13.9) |
4.4 (2.9–5.9) |
2.1 (1.1–3.2) |
|
Western |
12.0 (9.1–15.0) |
2.0 (0.7–3.3) |
1.3 (0.3–2.3) |
|
|
|
|
|
|
Ireland |
17.4 (16.3–18.4) |
5.0 (4.4–5.7) |
2.6 (2.1–3.0) |
|
|
|
|
|
Repository Staff Only: item control page