Collins, Patrick, Carew, Anne Marie  ORCID: https://orcid.org/0000-0002-8026-7228, Craig, Sarah, Galvin, Brian ORCID: https://orcid.org/0000-0002-5639-1819, Lyons, Suzi ORCID: https://orcid.org/0000-0002-4635-6673 and Quigley, Martin
(2023)
Analysis of the relationship between addiction treatment data and geographic deprivation in Ireland.
Drugnet Ireland,
Issue 84, Winter 2023, insert,
pp. 6-13.
ORCID: https://orcid.org/0000-0002-8026-7228, Craig, Sarah, Galvin, Brian ORCID: https://orcid.org/0000-0002-5639-1819, Lyons, Suzi ORCID: https://orcid.org/0000-0002-4635-6673 and Quigley, Martin
(2023)
Analysis of the relationship between addiction treatment data and geographic deprivation in Ireland.
Drugnet Ireland,
Issue 84, Winter 2023, insert,
pp. 6-13.
| Preview | Title | Contact |
|---|---|---|
|
PDF (Drugnet Ireland 84, insert)
- Supplemental Material
661kB | |
|
PDF (Drugnet Ireland 84)
1MB |
Introduction
The Pobal HP Deprivation Index, developed by Haase and Pratschke in 2017, uses 2016 Census data to determine relative scores of disadvantage or affluence for Ireland’s 18,488 Small Areas (SA).1,2 This index is Ireland’s primary social gradient tool used regularly for the allocation of State resources to target community-level disadvantage.
SAs sit within Electoral Division boundaries and are the lowest level of geographic boundary in Ireland. They correspond to between 80 and 120 dwellings, relating to townlands or neighbourhoods. They were created by the National Institute for Regional and Spatial Analysis on behalf of Ordnance Survey Ireland in consultation with the Central Statistics Office (CSO).3
The National Drug Treatment Reporting System (NDTRS) is an epidemiological database of drug and alcohol use treatment in Ireland maintained by the Health Research Board (HRB) on behalf of the Department of Health. The national drug and alcohol strategy, Reducing Harm, Supporting Recovery: a health-led response to drug and alcohol use in Ireland 2017–2025, requires all publicly funded drug and alcohol services to complete the NDTRS for all people who use services (Action 5.1.47).4 The NDTRS includes cases (or episodes) treated in all types of services: outpatient, inpatient, low threshold, general practitioners, and those treated in prison.
The concept for a project to analyse the relationship between addiction treatment data and geographic deprivation in Ireland, arose from discussions between Pobal and the HRB. Both organisations were looking to maximise the use and impact of their data in such a way that better leverages decisions from a policy and operational planning perspective.
Research aims and methodology
The aim of this small-scale research project was to demonstrate the potential for geographic analysis of the HRB addiction (alcohol and other drugs) treatment data when mapped onto area-based disadvantage using the Pobal HP Deprivation Index.1 This research can be viewed as complementary to the 2017 work of Haase and Pratschke2 in that it seeks to further demonstrate the empirical relationship between deprivation and addiction treatment and/or prevalence. It should be noted that the metric of addiction treatment represents a response to drug use, but can be used as a proxy indicator for prevalence, which is the estimation of drug use within a population.
Using anonymised addiction treatment data, this paper presents findings on the relationship between addiction treatment and geographic deprivation, as categorised by the Pobal HP Deprivation Index.
Datasets used in analysis
As mentioned previously, the analysis used two datasets:
- NDTRS: Three years of anonymised NDTRS data on alcohol and drug treatment episodes (2019, 2020, and 2021) were included in the analysis.
- Pobal HP Deprivation Index: The Deprivation Index used a series of data points from the Census to ascertain levels of disadvantage under the three domains of demographic profile, social class composition, and labour market situation at the level of Small Area. The data underpinning the Deprivation Index used in the analysis is drawn from the 2016 Census. The Deprivation Index bands are based on a normal distribution curve, where the majority of individuals in the State live in areas that are marginally above average and marginally below average. Only around 15% of individuals live in deprived (or very/extremely deprived) areas, with a similar percentage living in affluent (or very/extremely affluent) areas.
Preliminary analysis of data
The aim of the project was also to undertake a preliminary analysis of the data, using a relatively straightforward methodology of first-order descriptive analytics. An anonymised dataset was provided by the HRB to Pobal for geospatial analysis. This dataset included the SA identity (ID) related to where the case resided 30 days prior to treatment. Other variables provided included the unique centre code; gender; problem (alcohol, opioids, cocaine, cannabis, and other drugs); year treated; treatment status (never or previously treated); and number of times treated in that centre in that calendar year. Pobal joined the SA ID with the Pobal HP Deprivation Index, as well as mapping the data spatially using ArcGIS software.
Following an initial analysis of the treatment data with Deprivation Index scores, it was decided that the national analysis required a reconceptualisation and reorientation of the data. This needed to be undertaken in such a way that also facilitated an assessment of SAs where there were no treatment records, so that these could be compared and analysed against areas that did include treatment episodes. This led to the creation of a dataset beginning with a list of all SAs, to which the sum total of drug treatment episodes, by episode type, was added. This allowed for a more comprehensive analysis of disadvantage characteristics associated with drug treatment episodes.
Coverage of Small Areas in NDTRS treatment data
In 2016, the NDTRS moved to a new online data entry portal. Since then, treatment records have included the SA associated with the residence of the treated case as part of routine data collection, through an arrangement with the Health Service Executive’s Health Atlas Ireland. The changeover of services from a paper-based system to the new online system took some time, so only data from 2019 onwards was included in the analysis to ensure that the best coverage of SA in the treatment data was included. In total, 70% of relevant addiction services participate in the NDTRS.
For the period 2019–2021, 91.5% of NDTRS treatment episodes had an associated SA. Missing SAs were due to a number of issues, but often because the address was unknown or unavailable, mostly in relation to homelessness.
Results
In total, 48,638 drug and alcohol treatment episodes with a SA code for the years 2019–2021 were provided for analysis, of which 46,004 (95%) could be associated with the necessary geographic information needed for categorisation under the Pobal HP Deprivation Index. Table 1 provides the number of drug and alcohol treatment episodes by deprivation category.
If there were no relationship between deprivation and drug and alcohol treatment, it would be expected that the number of episodes in very disadvantaged areas (n=3943) should be similar to the number in very affluent areas (n=555). However, there are substantially more treatment episodes recorded in disadvantaged areas than in affluent ones.
Table 2 presents the percentage of drug and alcohol treatment episodes by deprivation band compared with the percentage breakdown of the Pobal HP Deprivation Index in the overall population. For example, while 2.8% of the population live in SAs classified as ‘very disadvantaged’, 8.6% of all drug and alcohol treatment episodes are reported from these areas. This is even more pronounced when looking at drugs. Some 11.03% of all opioid treatment episodes are reported from very disadvantaged areas, but only 2.8% of the population live in these areas.
Putting drug and alcohol treatment data alongside the distribution of deprivation for the general population allows for the comparison and identification of which areas are under-represented and over-represented in terms of the number of treatment episodes. The proportion chart in Figure 1 shows a more visual representation of the distribution of opioid treatment by deprivation band in the population, as outlined in Table 2.
Table 2 also highlights that while the number of drug and alcohol treatment episodes reported from very affluent areas are low, they comprise a greater share of opioid drug treatments than for any other drug type. This may be attributable to codeine products rather than heroin or methadone or variations in reporting to the NDTRS, but it needs to be investigated further.
Table 1: Number of NDTRS treatment episodes, by drug type and Pobal HP Deprivation Index band, 2019–2021
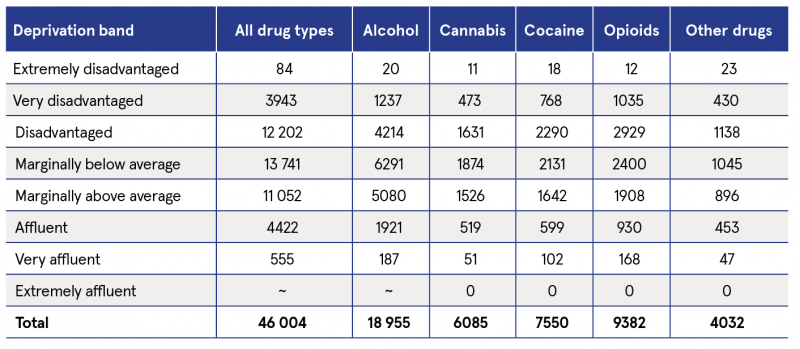
~ Cells with five cases or fewer
Table 2: NDTRS treatment episodes, by percentage drug type and general population, and Pobal HP Deprivation Index band, 2019–2021
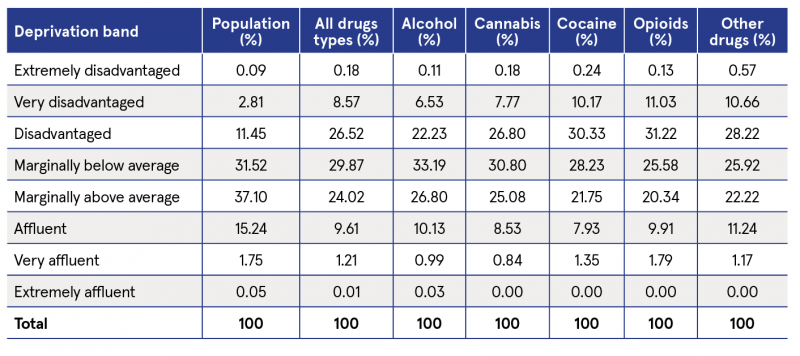
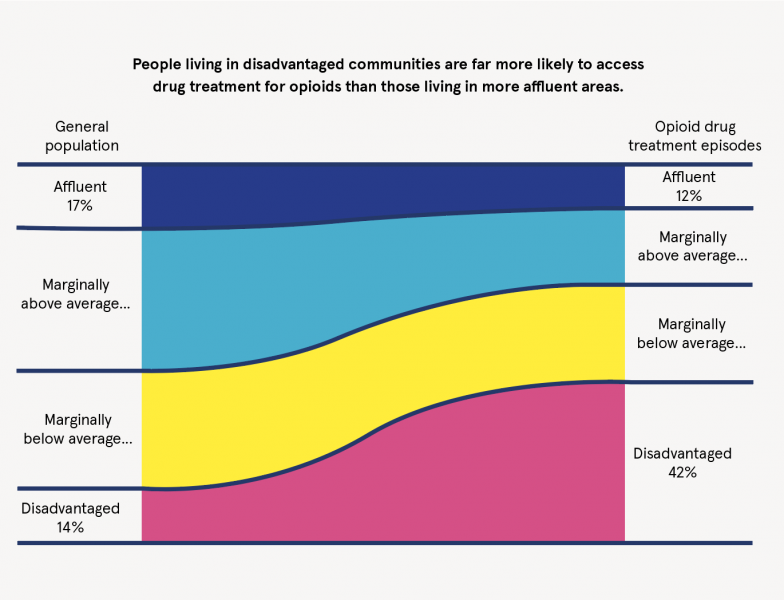
Figure 1: NDTRS opioid treatment episodes, by Pobal HP Deprivation Index band, 2019–2021
Figure 1 clearly demonstrates the relationship between deprivation and opioid treatment. While 14% of the population are from all areas of disadvantage, 42% of all opioid treatments are reported from these areas. While it is correct that there appears to be a relationship between area-based disadvantage and treatment uptake, it is not correct to say that drug and alcohol treatment is provided only to those from disadvantaged areas. Indeed, almost one-third of all treatment episodes are reported from areas of above average affluence, although this figure varies greatly by drug type.
For the purpose of this analysis, the metric of treatment episodes per 10,000 population was calculated for each Deprivation Index band for the three-year period of 2019–2021. The number of treatment episodes per 10,000 population in the bands ‘very and extremely disadvantaged’, as well as in ‘disadvantaged’, is considerably higher than for average and affluent areas (see Table 3). Of note, the data suggest that the difference between the three bands, ‘marginally above average’, ‘affluent’, and ‘very and extremely affluent’, is minimal. This requires further investigation. The slightly higher rate, 66 per 10,000 population, in the ‘very and extremely affluent’ band appears to be attributable to the higher number of treatments for alcohol, especially in rural areas of high affluence.
The same data in Table 3 are also presented in Figure 2, which visually demonstrates the relationship between Deprivation Index score and the rate of treatment episodes per 10,000 population.
A further analysis was completed by drug type using the CSO’s urban and rural classification, per 10,000 population (see Figure 3). Within urban areas, the linear trend of higher-reported drug and alcohol treatment episodes in disadvantaged areas can be observed across all drug types. However, in rural areas the rate of drug and alcohol treatment episodes for all drug types, apart from alcohol, is quite low across all deprivation bands.
Table 3: NDTRS treatment episodes per 10,000 population, by Pobal HP Deprivation Index band, 2019–2021
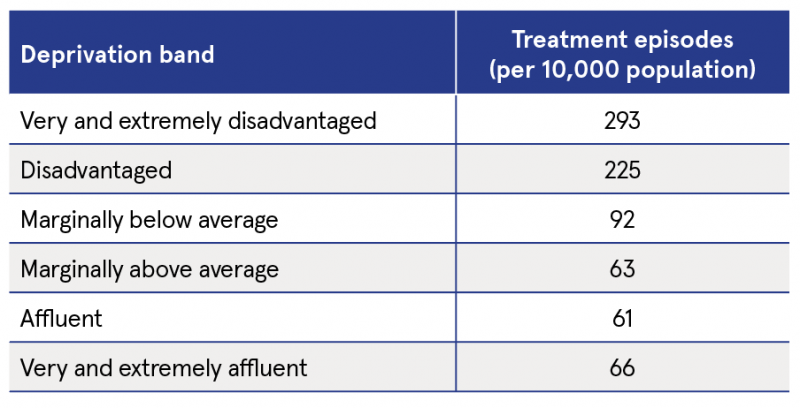
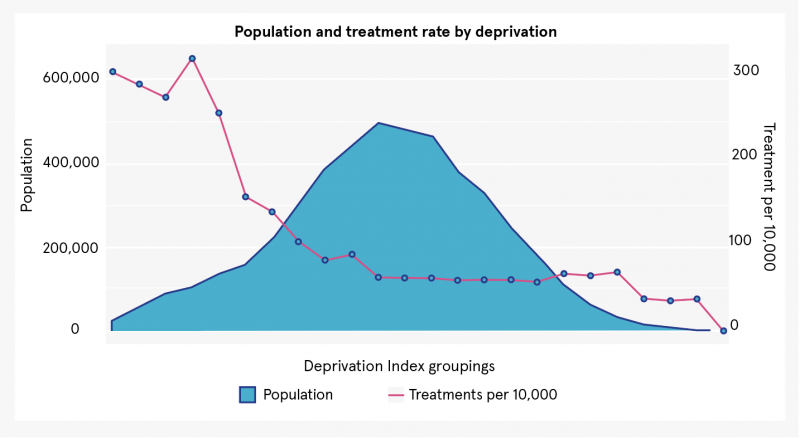
Figure 2: NDTRS treatment episodes per 10,000 population, by Pobal HP Deprivation Index, 2019–2021
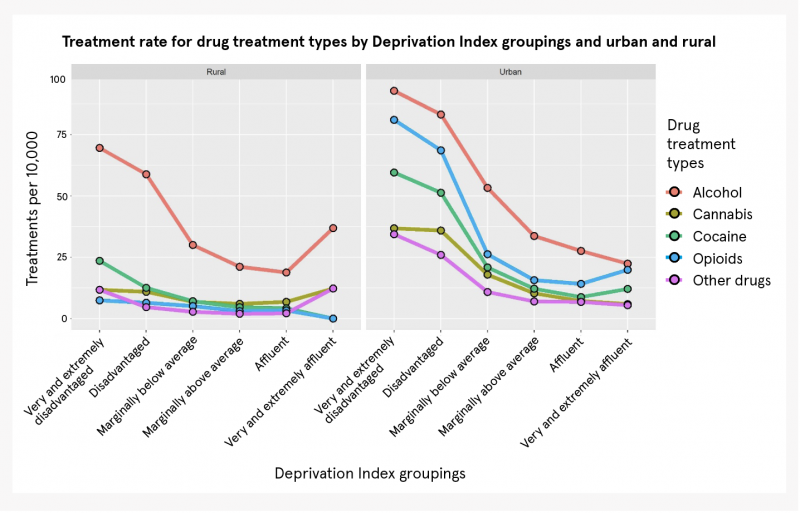
Figure 3: NDTRS treatment episodes per 10,000 population, by Pobal HP Deprivation Index band, urban/rural classification, and drug type, 2019–2021
Conclusion
Health policy is increasingly framed in terms of furthering healthy outcomes and positive wellbeing. The Sláintecare programme envisages a radical shift from acute hospital settings to community health supports with greater emphasis on self-care and prevention.5,6 This will entail a more targeted distribution of resources to ensure services are provided where they are most needed. Substance use is an area where the social determinants of certain behaviours and outcomes is very apparent. This project demonstrates that it is possible and useful to map drug and alcohol treatment to the Pobal HP Deprivation Index. It demonstrates a relationship between area-based disadvantage and the prevalence of drug and alcohol treatment episodes. The analysis found, for example, that while just 14% of the national population come from the areas classified as disadvantaged on the Pobal HP Deprivation Index, 42% of drug treatment episodes, where opioids were the primary drug type, were reported from these areas.
When calculated as a measure of treatment episodes per 10,000 population, the relationship between disadvantage and drug and alcohol treatment is evident, with 293 treatments per 10,000 in very and extremely disadvantaged areas, while the rate ranged from 61 to 66 in all areas of above average affluence.
Treatment episodes for all drugs had a relatively linear relationship with deprivation, that is, higher in more deprived areas. However, this appears largely driven by urban areas. In rural communities, the overall rate of drug treatment episodes is lower for all drug types, apart from alcohol, and the relationships with area-based deprivation are less pronounced. This type of analysis may provide an opportunity to identify the communities where the need for prevention, treatment, harm reduction and rehabilitation services are most likely to be greater.
The analysis shows that there is the potential to use Deprivation Index data as a means of objectively understanding or predicting levels of drug and alcohol treatment demand (i.e. drug prevalence). However, other factors, such as age profile and drug use patterns, and in particular the availability of treatment places and options, may also influence this relationship and should be considered alongside the data points presented above for any future analysis.
The analysis has raised a number of questions for further consideration. For example, the greater share of opioid drug treatments than any other drug type is reported from very affluent areas. Further analysis, along with the introduction of other factors, is likely to provide important perspectives on the demand for and allocation of drug and alcohol treatment services.
An impact analysis of the missing SA values in the NDTRS was not undertaken to ascertain if this could in any way introduce bias in the data analysis. If further more in-depth analysis is required, particularly at a more local level, then the impact of the missing values would need to be considered, especially in relation to non-participation in the NDTRS.
There is also the potential to expand the project to include other relevant data sources, for example, the National Drug and Alcohol Survey and the National Drug-Related Deaths Index. Some consideration could be given to the development of interactive maps of results and provide them to relevant stakeholders. In the meantime, the HRB will continue to work to improve the coverage of SAs in the NDTRS.
Next steps
The project will require additional input from a broader range of partners to progress this work of conducting further and more in-depth analyses of the relationship between addiction treatment and deprivation. This could be facilitated by an initial stakeholder workshop to consider findings and to identify areas for further investigation.
Patrick Collins (Pobal), Anne Marie Carew (HRB), Sarah Craig (HRB), Brian Galvin (HRB), Suzi Lyons (HRB) and Martin Quigley (Pobal)
1 Haase T (2016) The 2016 Pobal HP Deprivation Index (SA). Dublin: Trutz Haase Social and Economic Consultants. Available from: http://trutzhaase.eu/deprivation-index/the-2016-pobal-hp-deprivation-index-for-small-areas/
2 Haase T and Pratschke J (2017) A performance measurement framework for drug and alcohol task forces. Dublin: Trutz Haase Social and Economic Consultants. https://www.drugsandalcohol.ie/27488/
3 Central Statistics Office (CSO) (2016) Census 2016 Boundary Files. Dublin: CSO. Available from:
https://www.cso.ie/en/census/census2016reports/census2016boundaryfiles/
4 Department of Health (2017) Reducing Harm, Supporting Recovery: a health-led response to drug and alcohol use in Ireland 2017–2025. Dublin: Department of Health. https://www.drugsandalcohol.ie/27603/
5 For further information on Sláintecare, visit:
https://www.gov.ie/en/campaigns/slaintecare-implementation-strategy/
6 Department of Health (2021) Sláintecare implementation strategy & action plan 2021–2023. Dublin: Government of Ireland. https://www.drugsandalcohol.ie/34321/
J Health care, prevention, harm reduction and treatment > Treatment and maintenance > Treatment factors
J Health care, prevention, harm reduction and treatment > Health care delivery
J Health care, prevention, harm reduction and treatment > Health care administration
J Health care, prevention, harm reduction and treatment > Health care economics
L Social psychology and related concepts > Life circumstances
MA-ML Social science, culture and community > Risk by type of society and culture
MA-ML Social science, culture and community > Risk by type of society and culture > Rural society
MA-ML Social science, culture and community > Risk by type of society and culture > Urban society
MA-ML Social science, culture and community > Social condition > Poverty / deprivation
VA Geographic area > Europe > Ireland
Repository Staff Only: item control page