Condron, Ita (2018) Drug treatment figures from the NDTRS, 2010—2016. Drugnet Ireland, Issue 67, Autumn 2018, pp. 7-8.
| Preview | Title | Contact |
|---|---|---|
|
PDF (Drugnet 67)
730kB |
The National Drug Treatment Reporting System (NDTRS) published its latest figures on treated problem drug use (excluding alcohol) in May 2018.1 These figures exclude those who reported alcohol as their primary problem substance as this will be reported in a separate bulletin. In the seven-year period, 2010—2016, 63,187 cases were treated for problem drug use (excluding alcohol). The number of cases increased from 8,806 in 2010 to 9,227 in 2016.
In 2016, the NDTRS began the implementation of a new web-based data collection tool; this has significantly changed the way the NDTRS works and the transition may have contributed to the reduction in the number of cases reported for 2016. While fewer cases were reported for 2016 than 2015, the trends remained consistent with those reported for 2010 to 2015.
Service provider
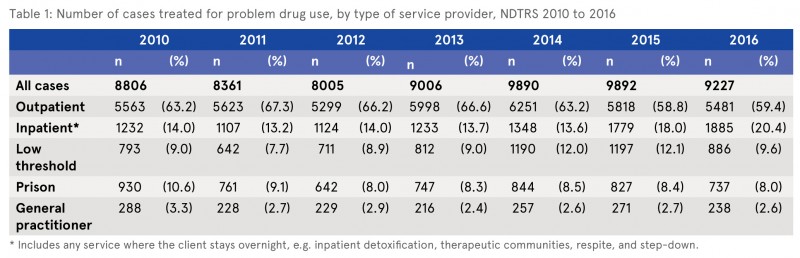
The majority of cases were treated in outpatient facilities (63.4%) over the period, similar to previous years (see Table 1). The proportion of cases treated in prison decreased slightly from 10.6% to 8% over the reporting period. In 2016, the proportion of cases treated in residential facilities was 20.4%, an increase from 14% in 2010.
Overview
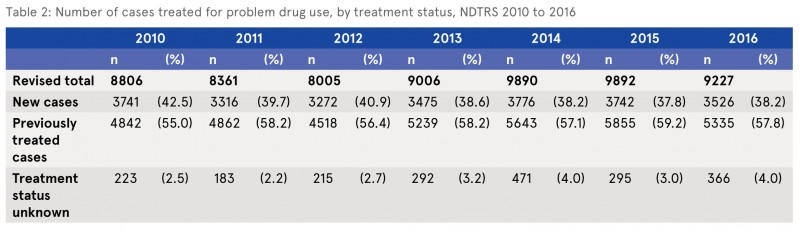
The proportion of new cases decreased over the period from 42.5% in 2010 to 38.2% in 2016 (see Table 2). The proportion of previously treated cases increased from 55% in 2010 to 57.8% in 2016. The increase in the number of previously treated cases is an indicator of the chronic, relapsing nature of addiction.
In 2016, the median age (age at which half the population is older and half is younger) of those treated was 30 years. The median age differed depending on whether the case was new (25 years) or previously treated (32 years). Over the reporting period, the median age of all cases treated increased from 28 years in 2010 to 30 years in 2016.
Similar to previous years, the majority of those treated in 2016 were male (72.4%). The proportion of cases that were homeless increased from 5.1% in 2010 to 9.6% in 2016.
The proportion of cases that identified as Travellers increased from 2.8% in 2010 to 3.2% in 2016. The proportion of Travellers in the general population is 0.7% (2016 Census).2 In 2016, two-thirds of all cases (66.2%) were unemployed. Unemployment rates in this group did not drop below 60% for all of the years reported. Unemployment rates were higher among previously treated cases.
Opiates (mainly heroin) continued to be the most commonly reported drug over the reporting period. The proportion of cases treated decreased from 58.1% in 2010 to 47% in 2016. Cannabis was the second most common drug reported among those treated. The proportion of cases reporting problem cannabis use increased by 23% in 2010 to 26.4% in 2016. Cannabis is the most common drug reported by new cases. Cocaine remained the third most common drug reported and, in 2016, 12.3% of cases reported problem cocaine use, the highest proportion reported since 2010.
Another significant finding was the increasing proportion of cases reporting benzodiazepines as a main problem drug, which rose from 4.1% in 2010 to 9.7% in 2016. In addition, the proportion of cases treated for Z-drugs increased from 0.1% in 2010 to 1.1% in 2016.
The bulletin also reports on treated problem use of novel psychoactive substances (NPS). In this period, reported problem use of NPS as a main problem peaked in 2010, at 2.5% of all cases treated, and dropped to 0.4% of all cases treated in 2012. Since then, it has increased slightly to represent 0.8% of all cases treated in 2016. The majority of cases reported problem polydrug use (62.7%) over the period; however, the proportion has decreased from 66.7% in 2010 to 61.8% in 2016. Up to 2013, alcohol was the most common additional drug reported.
Since 2014, benzodiazepines have become the most common additional drug reported by polydrug users.
The proportion of all cases treated who reported ever injecting remained relatively stable over the reporting period at around one-third of all cases. The proportion of new cases reporting ever injecting has decreased from 15.2% in 2010 to 13.5% in 2016.
1 Health Research Board (2018) Drug Treatment in Ireland NDTRS 2010 to 2016. Dublin: Health Research Board. https://www.drugsandalcohol.ie/28986/
2 Data on ethnicity is taken from the 2016 Census from the Central Statistics Office (CSO). Further information is available online at: http://www.cso.ie/en/csolatestnews/presspages/2017/census2016profile8-irishtravellersethnicityandreligion/
Repository Staff Only: item control page